

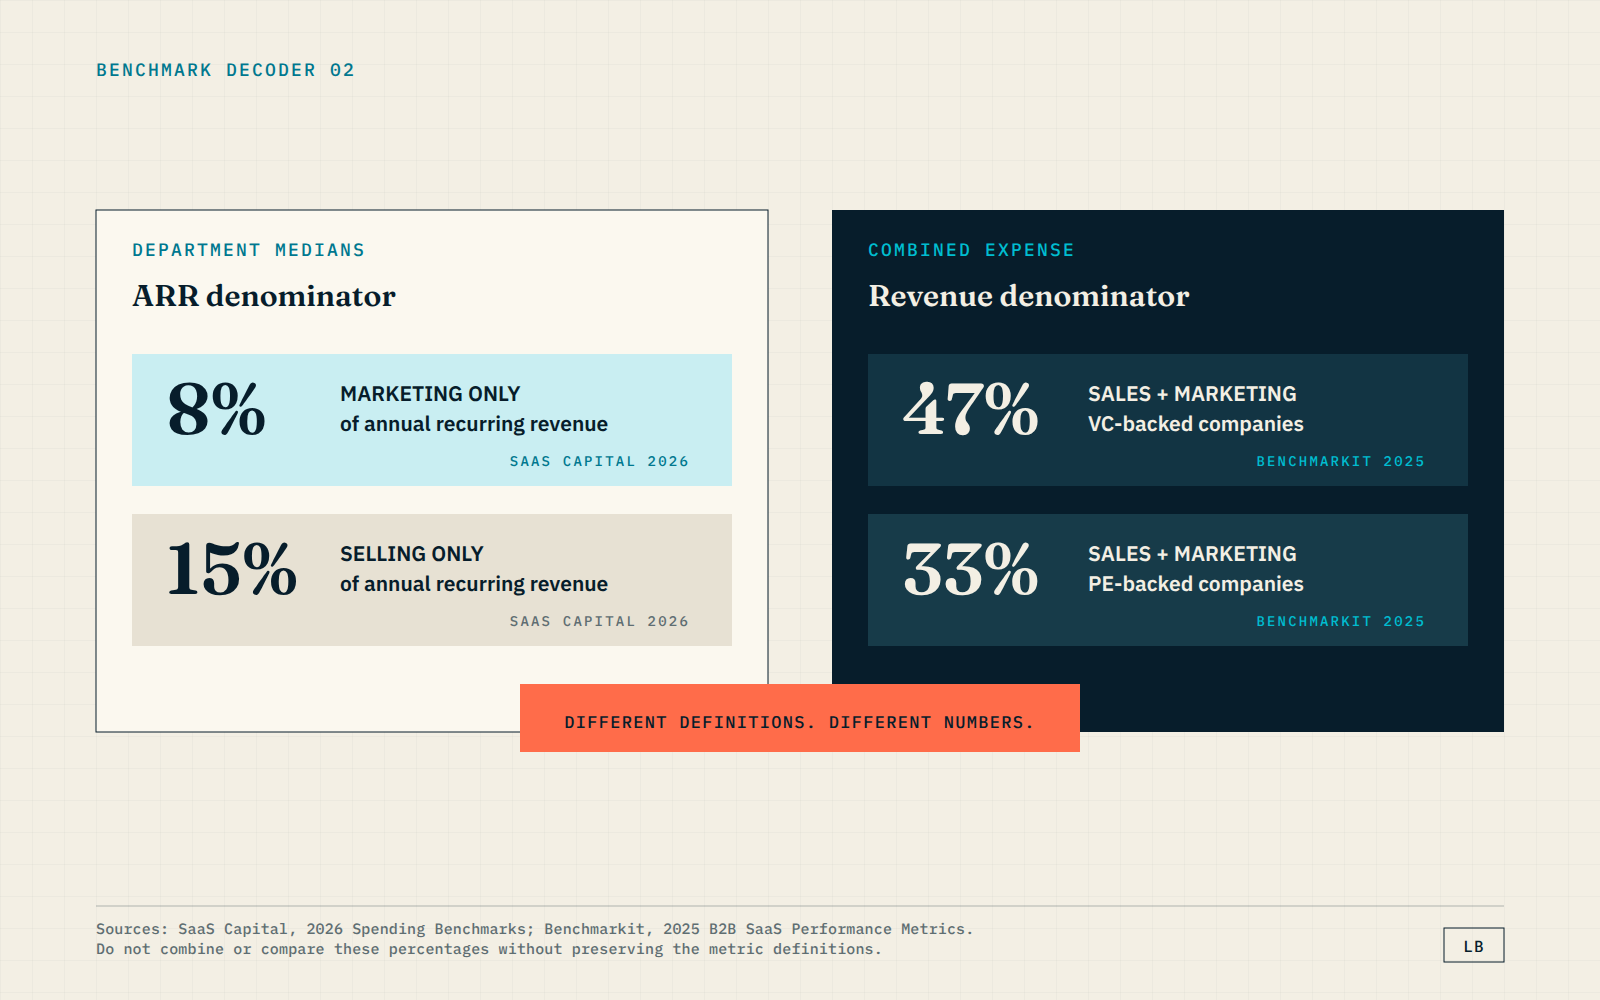
If you need a starting point for a B2B SaaS marketing budget, 8% of annual recurring revenue is the most widely-cited rule of thumb according to the 2026 median marketing spend reported by SaaS Capital from a survey of more than 1,000 private B2B SaaS companies. (The same study puts median selling costs at 15% of ARR.[1])
This 8% rule of thumb is useful but it's far from ideal as a rule for all SaaS orgs to follow, so I've created this guide to look deeper into the data across SaaS teams of various shapes and sizes.
Use these insights to figure out what budget should actually look like for your own SaaS marketing org.
Start with 8% of ARR, then test whether the comparison holds
The strongest current public benchmark for private B2B SaaS companies is straightforward:
Source: SaaS Capital's March 2026 survey of more than 1,000 private B2B SaaS companies.[1]
The 8% figure locates your budget, but it doesn't account for funding, growth targets, ACV, retention, sales motion, or expansion. One company can spend exactly 8% and still waste money on low-fit demand, while another might spend more and still be making rational investment decisions.
What that means for you is that you shouldn't automatically combine those figures and announce that every SaaS company should spend 23% of ARR on sales and marketing.
Even though that math works fine on a whiteboard, it falls apart the moment someone asks which department actually owns the number.
Another problem... Benchmarkit reports combined sales and marketing expense as a percentage of revenue, with a 2024 median of 47% for VC-backed companies and 33% for PE-backed companies.[2] Those figures answer an entirely different question from marketing as a percentage of ARR. The expense category is different. The denominator may be different. And the company populations are different.
If one figure says 8% and another says 47%, the research isn't flawed, but. you might be comparing two different metrics.
Before getting attached to any SaaS marketing budget benchmark, you should be thinking:
1. Does the figure include marketing only, or sales and marketing?
2. Is the denominator ARR, GAAP revenue, or another measure?
3. Is the statistic a median or an average?
4. What company population produced it?
5. Does that population resemble your company in ARR, funding, ACV, and go-to-market motion?
If you can't answer those questions, the percentage data is nominally-applicable at best.
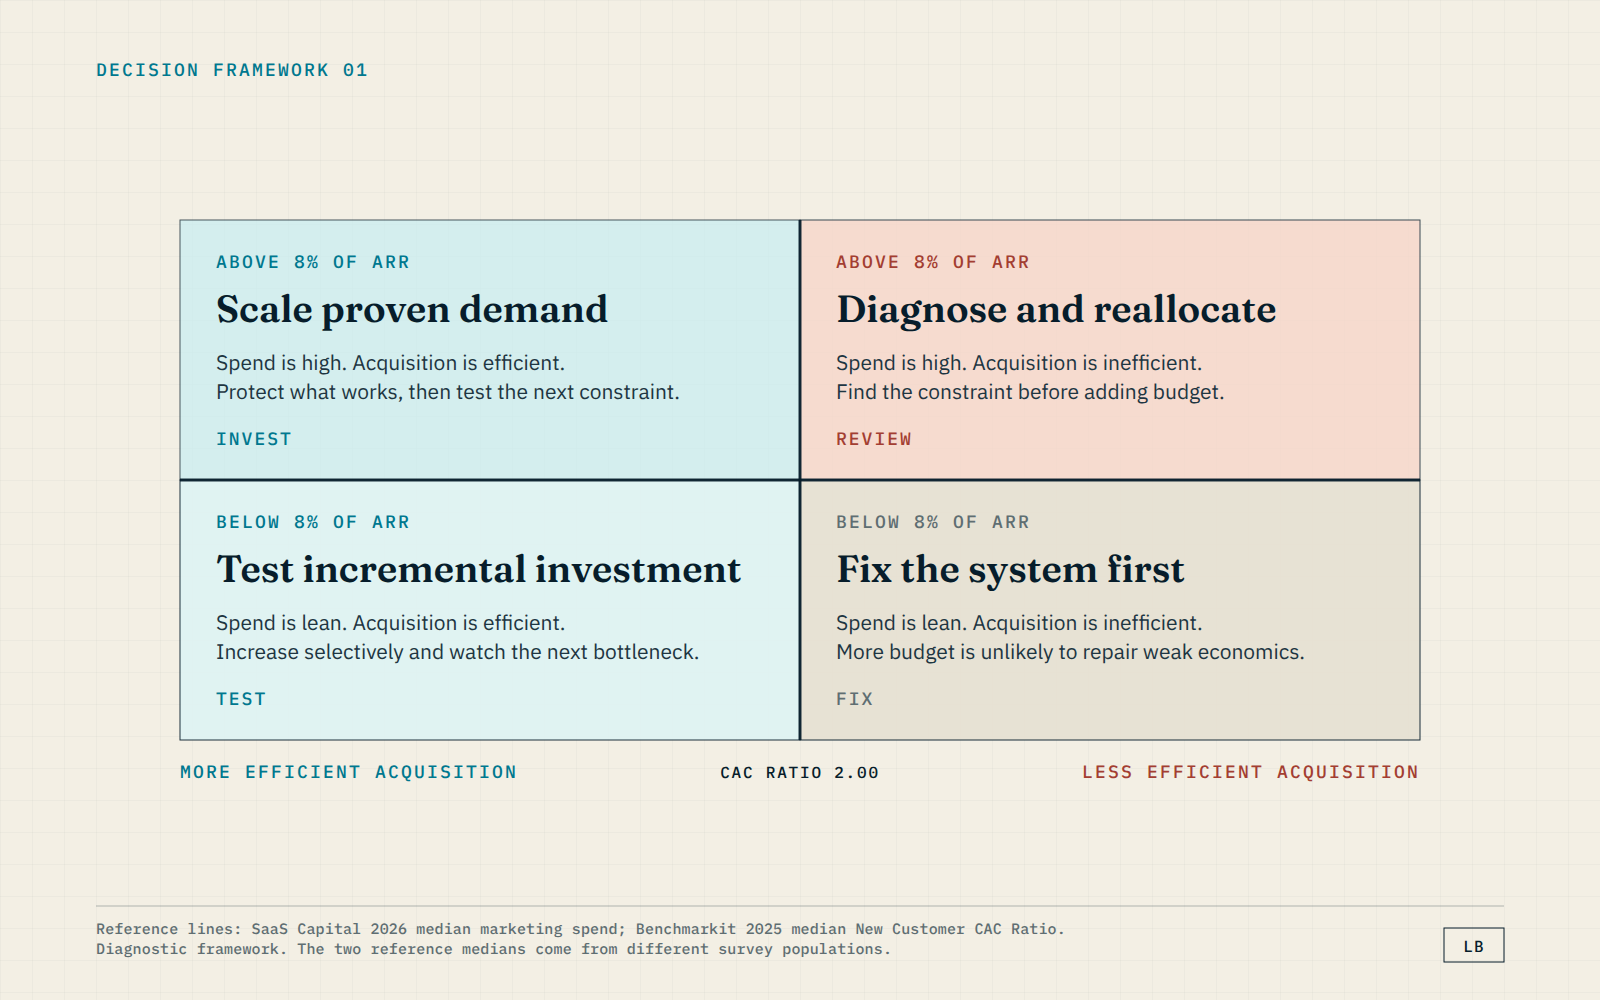
Why SaaS marketing budget benchmarks disagree
You've got to to define the terms and align on them.
A founder asks how much to spend on marketing. He or she might see one article with a marketing-only percentage. Another using full sales and marketing expense line. A third cites public-company revenue. Or a fourth that mixes venture-backed startups with profitable, bootstrapped companies.
Unless your benchmark numbers match your budgeting decision, they're irrelevent to your strategy.
The 2026 SaaS marketing budget benchmark
The following figures come from credible public sources, but they shouldn't be merged into one synthetic industry average. Each one measures a different part of the operating model.
Sources: SaaS Capital,[1] Benchmarkit,[2] Maxio,[3] and SaaS Capital's 2025 growth research.[4]
So what should you do?
Match the number to the question. Use marketing-only spend to size the department, combined sales and marketing expense to judge new-logo acquisition, and retention plus expansion to test whether demand generation is solving the right problem.
The SaaS Marketing Budget Triangulator
I use four lenses to turn a market benchmark into a company decision.
No lens is sufficient alone.
1. Establish the baseline
Calculate marketing expense as a percentage of ARR:
Marketing spend percentage = Annual marketing expense / ARR
If the result is 8%, you're close to the 2026 private B2B SaaS median. If it's 4%, your budget is relatively lean. If it's 14%, your budget is relatively heavy.
Stop there and you'll make the most common benchmarking mistake: treating position as performance.
A 4% budget may be disciplined, or it may leave the company invisible in a market where competitors are building category demand. A 14% budget may be bloated, or it may support an efficient expansion into a new segment.
The baseline tells you where to investigate. It doesn't deliver the verdict.
2. Define the growth posture
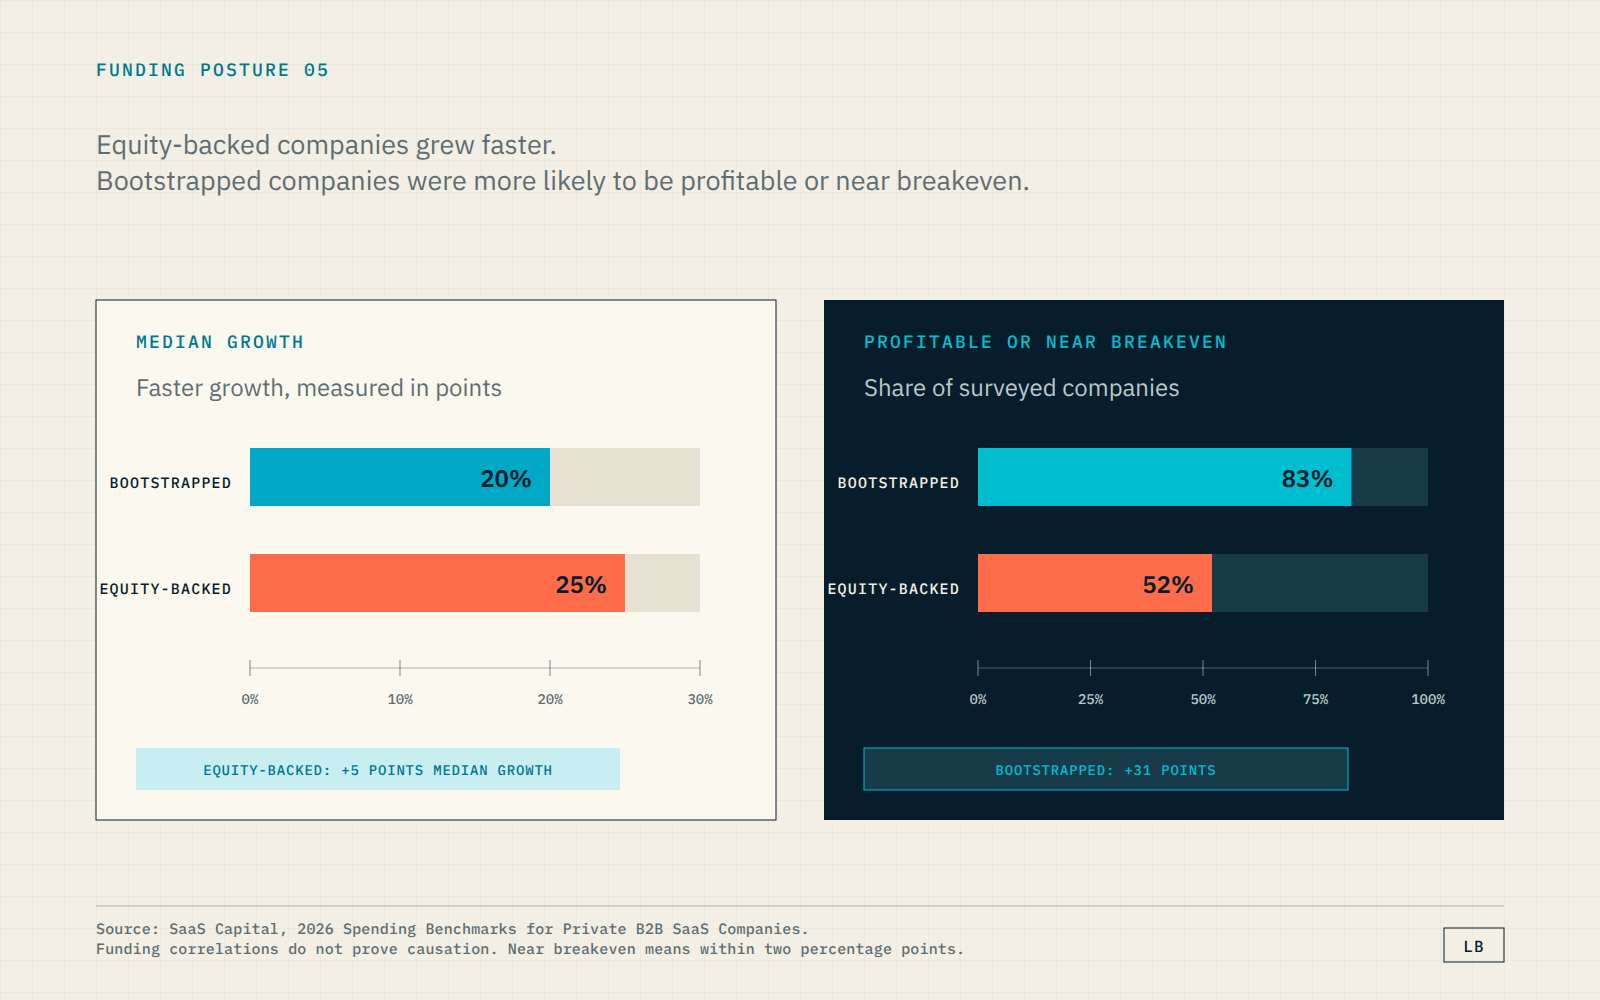
SaaS Capital's 2026 spending study reported median growth of 20% for bootstrapped companies and 25% for equity-backed companies. It also found that 83% of bootstrapped companies were profitable or within two percentage points of breakeven, compared with 52% of equity-backed companies.[1]
That doesn't prove that funding causes growth, or that losses are good. It just shows two different operating postures in the surveyed population.
A bootstrapped company might choose a lower budget because cash efficiency and control matter more than winning the category this year. An equity-backed company may accept losses because it's funding a defined growth plan. Both can be rational.
The useful question isn't, “Are we above the median?”
It is, “If we are above the median, what are we buying?”
The answer should be specific. Faster growth in a proven segment. Entry into a new market. A stronger partner motion. Better commercial-intent coverage. Improved conversion infrastructure. If leadership can't name the outcome, the budget isn't aggressive. It's just expensive.
Current conditions make that discipline more important. Maxio reported 18% average growth while 35% of companies declined year over year.[3] KeyBanc and Sapphire Ventures described a shift toward balanced growth and profitability, with expected ARR growth rising from 15% in 2024 to 20% in 2025.[5] Growth is less forgiving of vague spending.
3. Check the budget against acquisition economics
Marketing doesn't acquire customers alone. That's why the next test uses combined sales and marketing expense.
Benchmarkit defines New Customer CAC Ratio as:
New Customer CAC Ratio = Total sales and marketing expense / New-customer ARR
Its 2025 benchmark study reported a median ratio of $2.00 in sales and marketing expense for every $1.00 of new-customer ARR.[2]
That number also needs context. Benchmarkit found that ACV is closely related to CAC Ratio and that companies in the $10,000 to $50,000 ACV range were often more expensive to acquire than those in the $50,000 to $100,000 range.[2]
Mid-market deals can require meaningful human selling effort without the contract value of a larger enterprise agreement. Lower ACV doesn't guarantee lower acquisition cost.
Consider a hypothetical $4 million ARR company that spends $320,000 on marketing. Its marketing spend is exactly 8% of ARR.
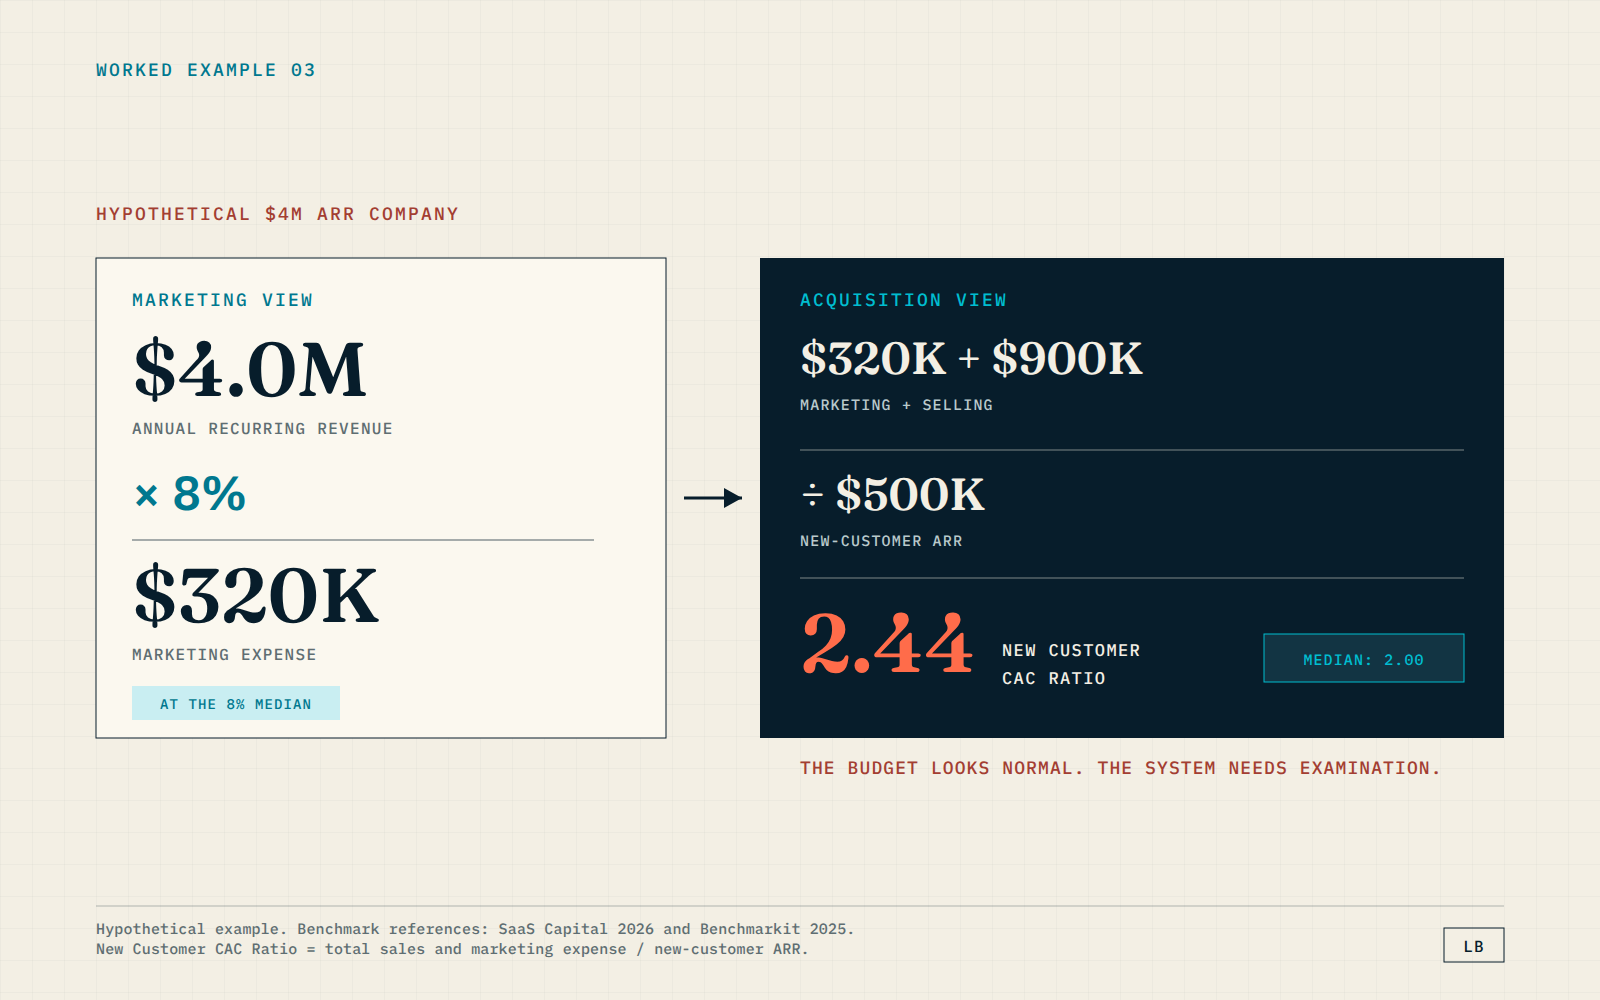
Now add $900,000 in selling expense. If the company produces $500,000 in new-customer ARR, its New Customer CAC Ratio is 2.44.
The marketing budget looks perfectly normal. The acquisition system is more expensive than the Benchmarkit median. That doesn't automatically make it bad, especially if ACV, gross margin, retention, and expected lifetime value support the spend. It does tell leadership where the real question sits.
Cutting marketing to hit 8% can be the wrong move here. The sales burden, conversion rate, qualification process, pricing, or deal cycle may be the larger constraint.
4. Check the budget against retention and expansion
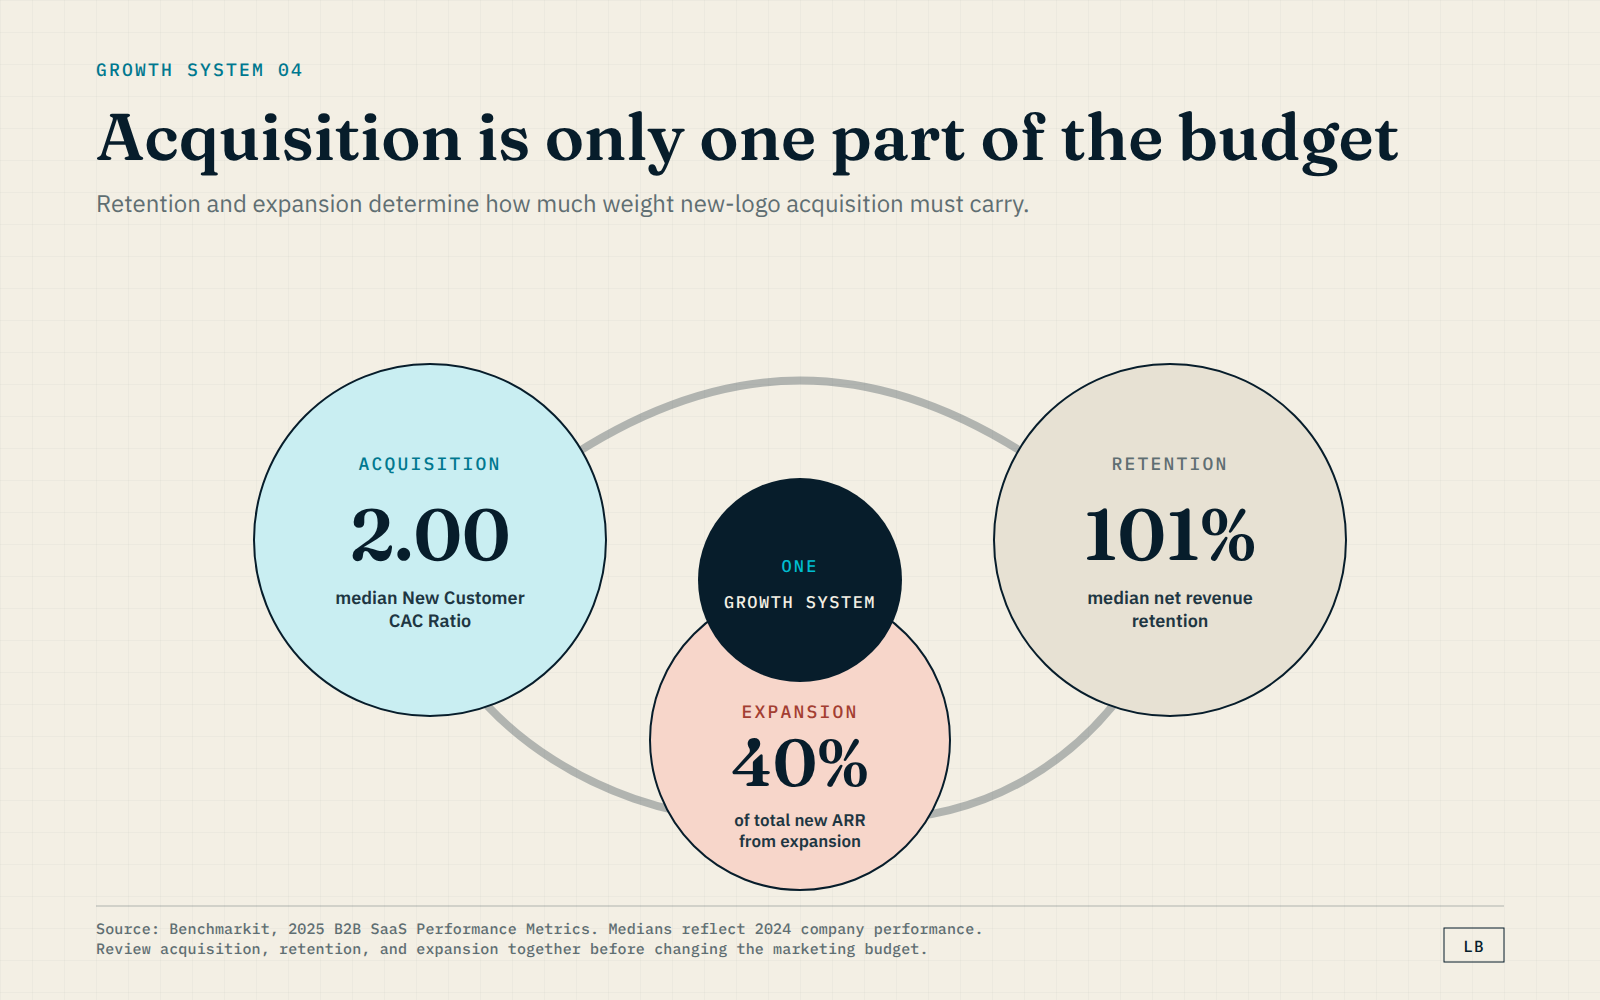
New-logo acquisition gets most of the attention because it's easy to point at. Retention and expansion determine how much weight that acquisition system has to carry.
Benchmarkit reported median NRR of 101% and found that expansion ARR represented 40% of total new ARR in its 2025 study.[2] SaaS Capital's 2025 growth research found that moving from the 90% to 100% NRR band into the 100% to 110% band was associated with five percentage points more growth.[4]
That's not permission to force an expansion program into every product. It's a reminder that budget efficiency is a company system.
If NRR is below 100% and expansion contributes little, marketing and sales must replace lost ARR before they create net growth. The company may respond by buying more leads, adding sales capacity, and raising the acquisition budget. The underlying leak remains.
In that situation, a higher marketing budget can make the top of the funnel look active while the revenue base keeps eroding underneath it. That's a great way to feel busy while going broke more slowly.
Ask two questions together:
1. How much does it cost to add new-customer ARR?
2. How much of that ARR survives and expands?
A budget review that ignores the second question is incomplete.
How ARR stage and funding change the budget decision
SaaS Capital gives one useful scale-specific reference. In its 2026 survey, the typical company with $3 million to $5 million in ARR reported median spending of 8% on marketing and 12% on selling.[1]
That cohort is more relevant to a $4 million ARR company than a blended benchmark that includes much larger businesses. It still doesn't prescribe the budget.
Funding tells you what the company can finance, not whether the plan is efficient. ARR identifies a more comparable peer group, not what the next dollar should fund. That dollar should go to the constraint that matters most.
When organic growth deserves more budget
Organic investment doesn't behave like rented demand. Paid activity usually slows down the moment the spend stops. Organic growth takes longer because the company is building commercial-intent coverage, technical accessibility, internal pathways, proof, and conversion architecture. It's not automatically better. Plenty of SaaS content never reaches a buying decision.
I'd increase organic investment when four conditions are present:
This is where budget allocation matters more than content volume.
I've seen the value of building a durable organic asset before an acquisition, scaling an organic acquisition program, and using content architecture to improve conversion outcomes. The common thread isn't “publish more.” It's connecting demand, evidence, and conversion.
Durability also matters during change. A company that has invested in clear content architecture and authority signals is better positioned to protect and transfer organic value during a post-acquisition integration.
If organic is only a line item for article production, keep the budget lean. If it's a commercial system that helps buyers discover, evaluate, and trust the company, benchmark it as an acquisition asset.
Five SaaS marketing budget failure modes
A practical B2B SaaS budget review checklist
Use this sequence before approving the plan:
Above the median and buying efficient, retained growth? Keep spending. Below the median and missing commercial demand, proof, and conversion paths? The budget may be too small. At the median with weak growth? Don't congratulate the spreadsheet. Diagnose the system.
Frequently asked questions
What percentage of ARR should a B2B SaaS company spend on marketing?
SaaS Capital's 2026 survey of more than 1,000 private B2B SaaS companies reported median marketing spend of 8% of ARR.[1] Use that figure as a baseline, then adjust your decision based on funding, growth posture, ACV, sales motion, CAC, NRR, and expansion.
Does a SaaS marketing budget include sales salaries and commissions?
A marketing-only budget usually doesn't. Combined sales and marketing expense can include sales compensation, commissions, sales development, enablement, and marketing costs. Check the source definition before comparing percentages.
What is a good New Customer CAC Ratio for SaaS?
Benchmarkit reported a 2024 median of $2.00 in sales and marketing expense for each $1.00 of new-customer ARR.[2] Treat that as directional. ACV, gross margin, retention, contract length, and sales motion can materially change what is sustainable.
How should a bootstrapped SaaS marketing budget differ from a VC-backed budget?
A bootstrapped company often places more weight on cash efficiency and profitability. An equity-backed company may finance higher spend to pursue faster growth. In SaaS Capital's 2026 survey, bootstrapped companies reported 20% median growth and equity-backed companies 25%, while a larger share of bootstrapped companies were profitable or near breakeven.[1] The appropriate budget depends on the operating posture, not funding status alone.
How does ARR stage affect SaaS marketing spend?
Scale changes company structure, growth rate, market reach, and selling cost. SaaS Capital reported that the $3 million to $5 million ARR cohort spent a median 8% on marketing and 12% on selling in 2026.[1] Use the closest credible cohort, then test the budget against your own acquisition and retention economics.
Why do SaaS marketing budget benchmarks disagree?
They often use different expense categories, denominators, populations, and statistics. Marketing-only spend isn't the same as combined sales and marketing. ARR isn't always the same as revenue. A median isn't an average. Read the methodology before using the percentage.
How does ACV affect SaaS customer acquisition cost?
ACV shapes how much sales effort a company can support and how acquisition cost should be interpreted. Benchmarkit found that CAC Ratio varies by ACV and that some $10,000 to $50,000 ACV companies were more expensive to acquire than companies in the $50,000 to $100,000 range.[2]
Should retention and expansion affect the new-customer marketing budget?
Yes. If retention is weak, new-customer acquisition must replace lost ARR before creating net growth. Benchmarkit reported median NRR of 101% and a 40% expansion contribution to total new ARR.[2] Review acquisition, retention, and expansion as one growth system.
How much should a $3M to $5M ARR SaaS company spend on marketing?
SaaS Capital's 2026 cohort benchmark was 8% of ARR for marketing and 12% for selling.[1] Those are medians, not recommendations. A company should still account for funding, growth target, ACV, sales motion, CAC, NRR, and expansion.
How often should SaaS benchmark data be updated?
Review benchmark sources at least annually and recheck material figures when planning a new budget. A page labeled 2026 should use current 2026 sources where available and clearly identify older supporting studies.
The decision rule
Don't increase or cut the budget just because a benchmark says you're high or low.
First, confirm that the comparison is valid. Then ask whether the budget is buying efficient growth, whether retention and expansion are carrying their share, and whether the allocation is creating assets that keep producing demand.
If your SaaS budget looks benchmark-comparable but the pipeline doesn't, the next step isn't another percentage. It's a diagnosis of where demand, conversion architecture, and commercial evidence are leaking value.
You can review the case-study evidence or consider when outside SEO expertise is worth funding before changing the total.
References
[1]: https://www.saas-capital.com/blog-posts/spending-benchmarks-for-private-b2b-saas-companies/ "SaaS Capital, 2026 Spending Benchmarks for Private B2B SaaS Companies"
[2]: https://www.benchmarkit.ai/2025benchmarks "Benchmarkit, 2025 B2B SaaS Performance Metrics Benchmarks"
[3]: https://www.maxio.com/resources/the-b2b-growth-report-2026 "Maxio, Winter 2026 B2B Growth Report"
[4]: https://www.saas-capital.com/research/private-saas-company-growth-rate-benchmarks/ "SaaS Capital, 2025 Private B2B SaaS Company Growth Rate Benchmarks"
[5]: https://investor.key.com/press-releases/news-details/2025/PRIVATE-SAAS-COMPANY-SURVEY-REVEALS-AI-DRIVEN-TRANSFORMATION-AND-SUSTAINED-OPERATIONAL-EXCELLENCE/default.aspx "KeyBanc Capital Markets and Sapphire Ventures, 2025 Private Company SaaS Survey"